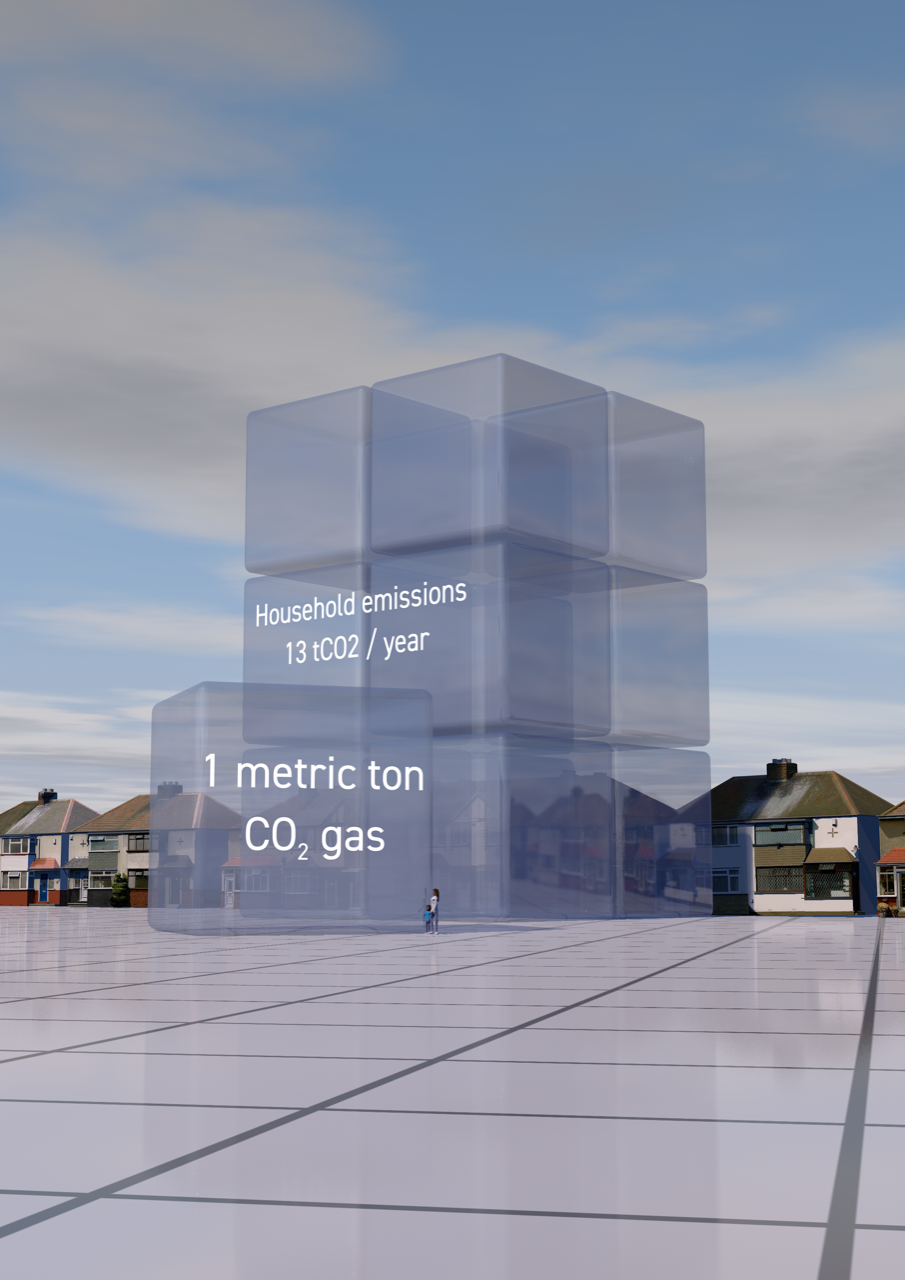
How would it feel if we could see the invisible carbon emissions associated with our daily lives?
We created a set of simple images showing the carbon emissions associated with an average UK home. These were designed for A3 Posters for an exhibition organised by Teignbridge Action on Climate (ACT). They show the carbon emissions associated with energy, transport e.g. car use, food, goods and services. Data has come from here: Impact Tool
Feel free to download and use for education or training. Images are licensed for use under Creative Commons.


